Many years ago, I came across an inventor who had developed a helmet contraption that can treat baldness. I asked him to explain the workings of the helmet, but he refused. He said that he did not want to reveal this. I did not think the helmet contraction worked as I saw only a tiny of small hair follicles growing on his scalp..
He did convince me that the market for his helmet contraption was huge. The fear of going bald is something that weighs on the minds, and scalps, of millions of men around the world.
Recently, a group of scientists from the UK and Pakistan have found a potential cure for male pattern baldness.
Researchers from the University of Sheffield and COMSATS University Pakistan discovered that a sugar which occurs naturally in our bodies can stimulate hair growth in mice.
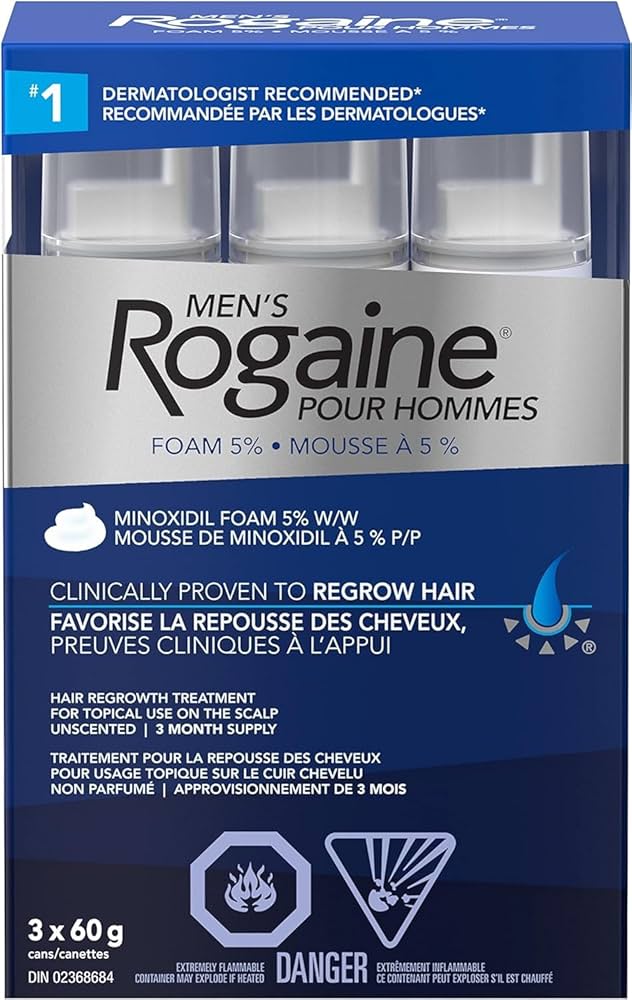
The sugar, 2-deoxy-D-ribose (2dDR), was just as effective at restoring hair to the balding rodents as commercially available drug minoxidil, also known as Rogaine, the drug owned by Johnson and Johnson.
Professor Sheila MacNeil, of the University of Sheffield, says: ‘This could offer another approach to treating this condition which can affect men’s self-image and confidence.’
The researchers had not originally set out to find a cure for baldness, but were rather investigating whether the sugar 2dDR could help improve wound healing.
When applied to the skin in the form of a gel, the sugar triggers increased growth of blood vessels which they hoped would cause cuts to close faster.
However, they soon noticed that the mice’s hair grew back much faster in the areas around the wound where the gel had been applied.
Intrigued, the research team decided to conduct an experiment to determine whether 2dDR could have an effect on male pattern baldness.
Mice were treated with testosterone to induce ‘testosterone-driven hair loss’ which is similar to male pattern balding in humans.
The researchers found that, after 20 days of treatment, both the sugar gel and minoxidil had promoted 80 to 90 per cent hair regrowth in mice with male pattern baldness.
Combining the two treatments, however, led to no noticeable improvements.
Professor MacNeil says: ‘Our research suggests that the answer to treating hair loss might be as simple as using a naturally occurring deoxy ribose sugar to boost the blood supply to the hair follicles to encourage hair growth.’
Male pattern baldness, or androgenic alopecia, is believed to affect between 40 and 50 per cent of men worldwide.
The condition is caused by a combination of genetic factors and levels of sex hormones which gradually lead to the permanent loss of hair follicles on the head.
Other research has recently suggested that the body’s ‘integrated stress response’ could lead to slowing hair growth and hair loss.
A follicle cell may become stressed, for example, as it ages and becomes less able to properly produce hair, slowing down growth.
And when the mechanism is over-activated, the hair follicle can even die and put a stop to any future growth.
However, as Professor MacNeil points out, ‘at the moment there are only two FDA licensed drugs to treat it.’
Patients can use the topical treatment minoxidil, sold as Rogaine, which can be slow and does not work for everyone suffering from hair loss.
Those who do not see improvements with minoxidil can also take the oral drug Finasteride, sold as Propecia, which works by decreasing the flow of testosterone.
However, this must be taken continuously once started and can be associated with severe side effects such as erectile dysfunction, testicular pain, reduced libido, and depression.
The researchers hope that their breakthrough with 2dDR sugar gels could provide a safer, naturally occurring alternative to these treatments.
he sugar 2dDR occurs naturally in the body as one of the components of the building blocks of our DNA – helping to form the deoxyribose part of deoxyribonucleic acid (DNA).
And, instead of altering the level of sex hormones like Finasteride, the treatment simply works by increasing the amount of blood which can reach the hair follicles.
In tests, the researchers found that this treatment caused the individual hair follicles to sprout long, thick, healthy hairs.
Professor Muhammed Yar, of COMSATS University Pakistan, says: ‘This pro-angiogenic deoxy ribose sugar is naturally occurring, inexpensive and stable.
‘This makes it an attractive candidate to explore further for treatment of hair loss in men.’
I hope this new discovery for treating baldness will benefit millions of men (as well as women), including me. When I met the inventor, I have a full crop of bushy hair,
Reference: Wiliam Hunter. Daily Mail, UK, July 25th, 2024.
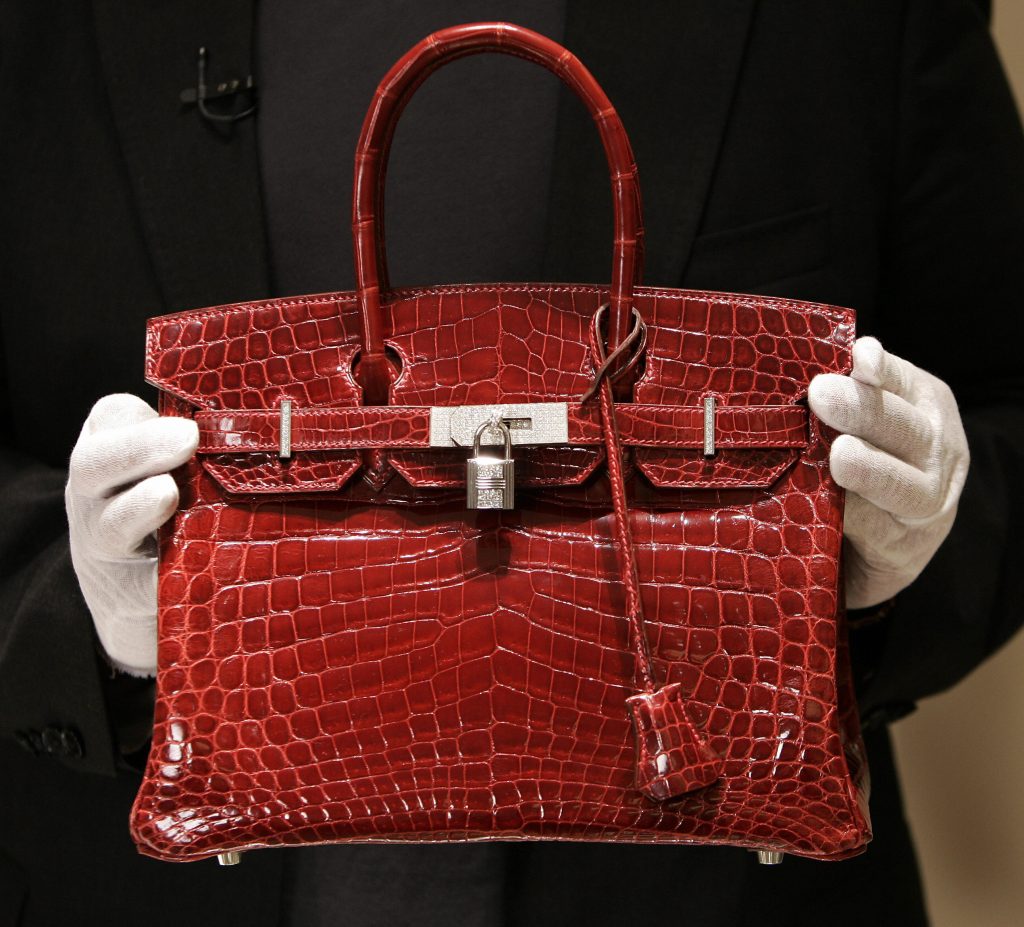
A Birkin handbag is the most expensive handbag for collection
An article in the London Sunday Times on February 28th, 2021, was an interesting one.
It quoted Hermes handbags, made by the French company, Hermes International SA, went up by 17 per cent in price while the FTSE 100 index fell by 14.3 per cent. Aside from being a highly desirable fashion accessories, luxury handbags are becoming an investment class of their own rights.
It was the second year in a row that bags outstripped other luxury goods in an index including classic cars, coloured diamonds, watches, jewellery and wine.
In 2019 handbags increased 13 per cent and over ten years they went up by 108 per cent in value, according to the estate agency, Knight Frank.
Hermes bags start at £1,418, and the label’s Birkin bag range usually begins at £6,370. A rare Hermes Himalaya Kelly bag made of crocodile hide became the most expensive handbag sold at an auction when it was bought at a Christie’s sale in Hong Kong for US$437,330 (£309,561) in November 2020.
According to the website, cnaluxury.channelnewsasia.com, it is possible to create an index on handbags now because of the frequency which many iconic pieces are coming to auction today. Although bags made by other luxury brands like Chanel and Louis Vuitton are also highly collectible, it is those made by Hermes that attract the highest prices and are considered the most desirable. Chanel is the second most popular handmade for collection.
The rise in value of handbags is also a result of brands increasing their prices every year, culminating in an increase in value in the pre-loved market. Hermes bags are the most difficult to get hold of, so they are the most coveted of all.
According to Knight Frank luxury investment index, fine wine went up 13 per cent last year and 127 per cent over a decade, bolstered by older Tuscan wines which increased by 8 per cent and champagne, which went up 14 per cent.
Art values fell 11 per cent on average because of the collapse in public auctions, and coloured diamonds fell 1 per cent because of the difficulty of transporting diamonds in the pandemic.
The conclusion of the article is obvious: Investing in a Hermes bag, especially a Birkin, will give a good return. Most important, it will also please your wife enormously. The caveat is that whether you can afford it.
Samsung is becoming part of our life; Samsung smartphones, Samsung television, Samsung monitor and Samsung refrigerator. It is not surprising this Korean company is a leader in high technology fields as it has the largest portfolio of active families of patents, according to ificlaims.com. This top position had been held by IBM, the American computer company, for almost 27 years. The ificlaims.com ranks 250 parent companies by active patents they own. The holdings of subsidiaries are included in the parent company’s holding. The top 100 companies are listed below.
Rank
Ultimate owner
Active families
Country
1
Samsung Electronics Co. Ltd
76,638
South Korea
2
International Business Machine Corp
37,304
US
3
Canon Inc
35,724
Japan
4
General Electric Co
30,010
US
5
Microsoft Corp
29,824
US
6
Robert Bosch
28,285
Germany
7
Panasonic Corp
27,298
Japan
8
Siemens
25,320
Germany
9
Intel Corp
24,628
US
10
LG Electronic Inc
23,043
South Korea
11
Hon Hai Precision Industry Co. Ltd
21,522
Taiwan
12
Qualcomm Inc
21,255
US
13
Sony Corp
21,167
Japan
14
Alphabet Inc
21,084
US
15
Toyota Motor Corp
20,814
Japan
16
Nokia Oyj
20,492
Finland
17
Fujifilm Holdings Corp
18,538
Japan
18
General Motors Co
17,778
US
19
Fujitsu Ltd
17,564
Japan
20
Hitachi Ltd
17,329
Japan
21
Ford Motor Co
16,942
US
22
United Technologies Corp
16,926
US
23
Volkswagen
16,470
Germany
24
Broadcom Inc
15,135
US
25
Honda Motor Co Ltd
15,072
Japan
26
Ericsson AB
14,878
Sweden
27
Apple Inc
14,849
US
28
Seiko Epson Corp
14,377
Japan
29
Huawei
14,315
China
30
Toshiba Corp
14,201
Japan
31
Honeywell International Inc
13,892
US
32
HP Inc
13,673
US
33
Ricoh Co Ltd
13,321
Japan
34
Dell Technologies Inc
13,313
US
35
Oracle Corp
13,254
US
36
Texas Instruments Inc
13,253
US
37
Denso Corp
13,120
Japan
38
Mitsubishi Electric Corp
13,062
Japan
39
TSMC Ltd
12,792
Taiwan
40
Philips NV
12,474
Netherlands
41
Medtronic PLC
12,400
US
42
Johnson and Johnson
12,226
US
43
Cisco Systems Inc
11,498
US
44
Continental AG
11,195
Germany
45
BASF SE
10,987
Germany
46
Boeing Co
10,897
US
47
Brother Industries Ltd
10,163
Japan
48
NEC Corp
10,152
Japan
49
Infineon Technologies AG
9,854
Germany
50
Airbus SE
9,741
France
51
Bayer AG
9,654
Germany
52
Amazon com Inc
9,455
US
53
GlobalFoundries Inc
9,426
US
54
BlackBerry Ltd
9,379
Canada
55
NXP Semiconductor BV
9,328
US/Netherlands
56
Xerox Holdings Corp
9,276
US
57
Procter and Gamble Co
8,950
US
58
Western Digital Corp
8,927
US
59
Valeo SA
8,913
France
60
Kyocera Corp
8,769
Japan
61
STMicroelectronics NV
8,630
Switzerland
62
LG Display Co Ltd
8,523
South Korea
63
Hyundai Moro Co
8,495
South Korea
64
Safran SA
8,332
France
65
3M Co
8,306
US
66
Hewlet Packard Enterprise Co
8,125
US
67
AT&T Inc
8,106
US
68
SK Hynix Inc
7,934
South Korea
69
Olympus Corp
7,924
Japan
70
Micron Technology Inc
7,488
US
71
National Research Council of Science and Technology
7,226
South Korea
72
Schlumberger Ltd
7,412
US
73
Konica Minolta Inc
7,366
Japan
74
BOE Technology Group Co Ltd
7,236
Japan
75
Renesas Electronics Corp
7,002
Japan
76
Corteva Inc
6,856
US
77
Nike Inc
6,787
US
78
Halliburton Co
6,638
US
79
Dow Inc
6,532
US
80
Boston Scientific Corp
6,519
US
81
Sumitomo Electric Industries Ltd
6,466
Japan
82
Lenovo Group Ltd
6,379
China
83
Abbot Laboratories
6,265
US
84
CEA
6,120
France
85
Murata Manufacturing Co Ltd
6,116
Japan
86
Nissan Motor Co Ltd
6,096
Japan
87
Peugeot SA
6,046
France
88
TDK Corp
5,939
Japan
89
Roche Holdings AG
5,732
Switzerland
90
Verizon Communications Inc
5,656
US
91
Caterpillar Inc
5,622
US
92
Semiconductor Energy Laboratory Ltd
5,586
Japan
93
Thales SA
5,500
France
94
Kioxia Corp
5,285
Japan
95
Schaeffler AG
5,172
Germany
96
ZF Friedrichshafen AG
5,152
Germany
97
LOreal SA
5,116
France
98
Applied Materials Inc
5,079
US
99
TCL Corp
4,886
China
100
BMW AG
4,855
Germany
Patent filing
since 1883
According to WIPO (World Intellectual Property
Organization) World Intellectual Property Indicators 2019 Report, from 1883 to
1963, the patent office of the US was the leading office for world filing.
Application numbers in Japan and the US were stable until the early 1970s, when
Japan began to see rapid growth—a pattern also observed for the US from the
1980s onward. Among the top five offices, Japan surpassed the US in 1968 and
maintained the top position until 2005. Since the early 2000s, however, the number
of applications filed in Japan has followed a downward trend. Both the EPO
(European Patent Office) and South Korea have seen increases each year since
the early 1980s, as has China since 1995. China surpassed the EPO and South
Korea in 2010, Japan in 2010 and the US in 2011— and now receives the largest
number of application worldwide. This also coincides with the emergence of
Chinese companies to develop their own technologies, which is led by Huawei
Technologies Co., Ltd.
South Korea continues to file the
highest number of patents per unit of GDP
Variations in patenting activity across countries
reflect differences in their size and the structure of their economies. It is
therefore informative to examine resident patent activity with regards to population,
research and development, gross domestic product 9GDP) and other variables.
With 8,561 patent applications per unit of US$100 billion GDP, South Korea continued to file the largest number of patent applications. China (6,183) had the second largest ratio in 2018, followed by Japan (5,101), Germany (1,924) and Switzerland (1,831). However, over the past 11 years, the gap between South Korea and China has narrowed considerably, reflecting the strong growth in resident applications in China, with resident application per unit of GDP increasing from 1,854 in 2008 to 6,183 in 2018.
Focus areas of patent application by
leading companies
According to the World Intellectual Property Indicator 2019 Report, the leading companies submitted patent applications from 2014 to 2016 were in technology fields as follows:
Rank
Company
Technology
fields
1
Samsung
Telecommunication, digital communication, computer technology, semiconductors, optics and electrical machinery, apparatus and energy
2
IBM
Digital communication, computer technology, IT method for management semiconductor and audio-visual technology
3
Canon
Audio-visual technology, computer technology, optics, telecommunication, semiconductors, measurement and textile and paper machines
6
Robert
Bosch
Transport, engines and turbines, machine tools, control, measurement, computer technology and digital communication
15
Toyota
Motor Corp
Engines, pumps and turbines, mechanical elements transport, computer technology, semiconductors, measurement and control
29
Huawei
Technologies
Audio-visual technology, digital communication, telecommunication, computer technology and measurement and optics
Universities and PROs in Korea are
active applicants of patent in 2014 to 2016
The South Korean universities and PROs (public research organizations) are also active applicants of patents. The list of leading universities and PROs is shown below.
No
University or PRO
Technology fields
1
AIST (National Institute of Advanced Industrial Science and Technology), Japan
Semiconductor, measurement organic fine chemistry and biotechnology and electrical machinery, apparatus and energy
2
CEA,
France
Computer technology, semiconductor thermal processes and apparatus and telecommunication
3
CNRS,
France
Electrical machinery, apparatus and energy, computer technology, semiconductors, measurement analysis of biological materials, medical technology, organic fine chemistry, medical technology biotechnology and pharmaceuticals
4
DLR,
Germany
Measurement, control, thermal processes and apparatus, handling, engines, pumps and turbines and transport
5
Fraunhofer,
Germany
Computer technology, optics, digital communication, semiconductor, measurement, and machine tools
6
Harbin
Institute of Technology (China)
Electrical
machinery, apparatus and energy, computer technology, measurement and
materials and metallurgy and environmental technology
7
KAIST,
South Korea
Computer technology, digital communication telecommunication, measurement and optics
8
Korea
Electronics and Telecomm
Telecommunication,
digital communication, audio-visual technology computer technology and IT
methods for management
9
MIT,
US
Measurement, medical technology, biotechnology, pharmaceutical computer technology and electrical machinery, apparatus and energy
10
Tokyo
University, Japan
Biotechnology, pharmaceuticals, measurement computer technology and electrical machinery, apparatus and energy
11
University
of California, US
Medical technology, biotechnology, pharmaceuticals, organic fine chemistry measurement, computer technology and electrical machinery, apparatus and energy.
12
Zhejiang
University, China
Measurement, biotechnology, computer technology materials and metallurgy and electrical machinery, apparatus and energy
Our comments
It is noted that South Korea’s leading companies
such as Samsung, Hyundai and LG have made technological advances which are
incorporated into their products. Their progress has been supported by
universities and PROs.
China is also progressing up the technological ladder, which is led by Huawei. Taiwan has several companies which possess advanced semiconductor technologies, which is led by TSMC.
Our country, Malaysia, has not been successful in
creating companies that are involved in advanced technology fields. Malaysian
government’s effort to nurture domestic technology companies did not succeed
due to a number of factors.
Malaysia is a leading producer of palm oil as well
as a significant producer of oil and gas. Unlike Taiwan and South Korea,
Malaysian companies are happy to be involved in oil palm plantations that
generate regular profits through increased acreage.
The current turmoil in the oil industry and low prices of palm oil could spur a change in the economic development strategies through high technology industries involving digital and computer technologies. Looking at the advances made by Asian countries like South Korea, Taiwan and China, the challenge of Malaysia to catch-up with these countries is very enormous.
Last week we had lunch at a restaurant in Subang Jaya, near Asia e University. It served rice cooked in coconut milk with a choice of side dishes such as fried chicken and fried egg, which is commonly known as “nasi lemak”. We noted that the restaurant with a seating of about 20 were patronized mainly by non-Muslims. Half of the total seats were empty.
“Nasi lemak” is a popular Malaysian dish for all times of the day
Although potential Muslims patrons were checking the menu placed outside the restaurant but they did not enter. The main reason was that the restaurant did not display a ”Halal” logo at its entrance. The potential Muslim patrons knew that the menu offered by the restaurant did not have pork ingredients, but they would not enter the restaurant because it did not display “Halal” logo on its menu; thus loss revenue for the restaurant.
The restaurant should consider applying “Halal” certification/logo as its “nasi lemak” menu is popular with both non-Muslim and Muslim patrons.
Normally, the application for the “halal” certification/logo could be made directly by a restaurant’s owner. He/she could also appoint a consulting company to assist in the application process. This would usually cost about RM8,000-10,000.
Value of “Halal” Certification/Logo
The restaurant was not attracting Muslim customers as it did not have “Halal” certification/logo. The restaurant would be able to achieve higher patronage from Muslim diners if it had the “Halal” certification/logo.
Let us consider a hypothetical full-service restaurant with 20 seats. In this example, a typical dish with a soft drink is about RM15.00. There are two peak periods; lunch hour and dinner. Presently, during each peak period, we assume that 20 non-Muslim patrons would fill the restaurant (half of seating capacity). Thus, on a daily basis, the revenue of the restaurant is: 20 X 2 XRM15.00=RM600. During each peak period, there would be 20 non-Muslim patrons.
In a year, the annual revenue of the restaurant is RM219,000 (RM600 x 365).
If the restaurant is certified ”Halal” and displays the “Halal” logo, it would attract additional Muslim customers. We assume that the restaurant would now be full during the peak period. The daily taking is now: 40 X 2 xRM15.00=RM1,200.
In a year, the annual revenue of the restaurant is RM438,000.
The value of the “Halal” certification/logo could be estimated as follows:
Industry estimates
Not having “Halal” certification/logo
Having “Halal” certification/logo
Sales
100%
219,000
438,000
Costs of goods sold
30%
65,700
131,400
Payroll and benefits
35%
76,650
153,300
Operating expenses
7%
15,330
30,660
Occupancy expenses
10%
21,900
43,800
General and admin expenses
3%
6,570
13,140
EBITDA
32,850
65,700
Value of “Halal” certification/logo @ 8 per cent capitalization rate
410,625
821,250
Please note, in Malaysia, the “Halal” certification/logo is renewable every two years. Thus, the intangible “Halal” certification/logo has an indefinite life.
Based on this hypothetical restaurant example, the value of the “Halal” certification/logo is the difference between the value of not having and the value of having “Halal” certification/logo, that is RM410,625.
The value is substantial if more restaurant outlets are involved in a country like Malaysia with a predominantly Muslim population.
Conclusion
Having a “Halal” certification/logo would attract both non-Muslim and Muslim customers, thereby improving the revenue of a restaurant. The JAKIM “Halal” certification/logo has been accepted as a benchmark that the ingredients used in the menu of a restaurant are permitted by Islamic principles.
International food franchisers please take note!
Note:
Dato’ Dr Anuar Md Nor is a founder of Bison Consulting, which offers a range of management and technology services, including “Halal” certification/logo. Our website is www.bisonconsulting.net
Muslim consumers have been a major factor in the increased demands for food products and services that conform to the Islamic religious principles. These food products are considered “Halal” and that they contain ingredients that are permitted in Islam.
“Halal” Certification System
“Halal” originates from an Arabic phrase that means allowed or permitted by Islamic law. According to JAKIM (Department of Islamic Development Malaysia), the Malaysian authority that manages application for “Halal” certification, a “Halal” food means that:
Does not stem from or consists of any part of or item that is forbidden to Muslims by Islamic law, or animals that have not been slaughtered according to Islamic law.
Does not contain any substance that is considered impure in Islamic law.
Is not prepared, processed or manufactured using equipment or utensils that are not free from impurities as defined by Islamic law.
That, in the preparation, processing or storage stage, does not come in contact with or stored near any kind of food that does not meet the requirements of paragraph (a), (b) or (c) or any substances that are considered impure by Islamic law.
A food product manufacturer would apply to JAKIM for “Halal” certification process. Presently, the “Halal” certification is voluntary in Malaysia. Once approved, a “Halal” certificate would be issued to the successful food manufacturer. The “Halal” certificate is an assurance that a particular product or food premise (restaurant) has been thoroughly investigated and found to conform to Islamic law and therefore is suitable for use or consumed by Muslim consumers. Food products or premises certified as “Halal’ by JAKIM utilize the registered trademark “Halal’ logo.
Halal Logo Issued by JAKIM
The Halal’ logo is usually displayed prominently on the packages of the food product or showed in the signage of a food premise.
“Halal” Certification/Logo Has Become a Valuable Customer-Related Intangible Asset
In Malaysia, the value of the “Halal” certification/logo can be looked at from the patronage of food outlets. During the recent fasting month, most popular food outlets had fewer patrons, who were mainly non-Muslim customers. This indicates that the value of the “Halal” certification/logo intangible assets could be estimated by the additional volume of Muslim customers that could be generated if the food premises are certified “Halal”.
The value of “Halal” certification/logo would be substantial in countries such as Malaysia and Indonesia which have significant Muslim populations. Multinational food countries such as Nestle and Unilever have used their manufacturing facilities in Malaysia to produce “Halal” certified products with “Halal” logo displayed clearly on their food packages.
Halal Logo on a Food Package
The Test of Intangible Asset of “Halal” Certification/Logo for Valuation
For an intangible asset to exist from a valuation, accounting, and legal perspective, it must possess certain attributes, as defined in Reilly and Schweihs’s (1999) book, Valuing Intangible Assets. The authors define intangible assets as having the following attributes:
It is not physical in nature;
have specific identification and recognizable description;
Have legal existence and legal protection;
Is subject to private ownership and transferability;
Have tangible evidence or manifestation of the existence of the intangible assets;
Was created or came into existence at an identifiable time or as the result of an identifiable event; and
Is subject to term ination of existence at an identifiable time or as a result of an identifiable event.
Reilly and Nesi (1992) extend this list and state that for an intangible asset to have a quantifiable value from an economic perspective, it must possess certain additional attributes, such as:
Generate some measurable amount of economic benefits in the form of income or a cost decrease which may be measured in several ways , including net income, net operating income or net cash flows, etc.; and
Enhance the value of other assets which is it is associated.
Test of Attributes of “Halal” Certification/Logo as Intangible Asset for Valuation
The table bellows shows the test of attributes of “Halal” certification/logo:
No.
Attributes
Yes or No
1
It is not physical in nature
Yes.
It is in the form of “Halal” logo
2
have specific identification and recognizable description
Yes
The products are listed as “Halal” in JAKIM’s data base. The “Halal’ logo can be displayed in product packages and premise signage and in brochures.
3
Have legal existence and legal protection
Yes.
The “Halal” logo is protected by Malaysian law.
4
Is subject to private ownership and transferability
Yes.
The logo is owned by the food product manufacturer.
5
Have tangible evidence or manifestation of the existence of the intangible assets
Yes
“Halal” logo displayed on product packages, premises and brochures.
6
Was created or came into existence at an identifiable time or as the result of an identifiable event.
Yes.
The “Halal” certification/logo is issued after a inspection is made by JAKIM.
7
Is subject to termination of existence at an identifiable time or as a result of an identifiable event.
Yes.
The “Halal” certification/logo is valid for two years and can be renewed by an application to JAKIM.
8
Generate some measurable amount of economic benefits in the form of income or a cost decrease.
Yes.
Increased patronage of Muslim consumers, therefore revenue.
9
Enhance the value of other assets which is it is associated.
Yes.
The value of business would be increased due to additional market of Muslim consumers.
The next article would provide an example the estimated value of the “Halal” certification/logo intangible asset of typical food outlet in Malaysia.
Reference:
Reilly, F. and Nesi, N.A. (1992). Interstate intangible asset transfer, the CPA Journal Online, Vol. 62, No.8, pp. 34-40.
Please note we offer services to help local and foreign food companies to apply the JAKIM’s “Halal” certification in Malaysia. The JAKIM’s “Halal” logo is widely recognized as a trusted assurance for “Halal” food products. Please be free to contact Dato’ Dr Anuar at datodranuar@gmail.com or visit our website, www.bisonconsulting.net.
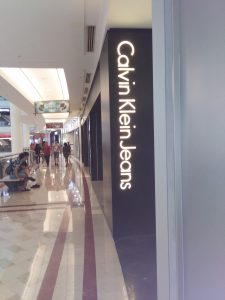
When we visit the KLCC Suria in Kuala Lumpur, Malaysia, a popular shopping mall, our eyes would be dazzled by illuminations of brands, from local brands to international brands. Lighted logos of brands are prominently placed at various points of their well-designed stores.
Brand owners should like my wife, Datin Azimah: toothpaste (Colgate), washing powder (Breeze), petrol (Shell), and fizzy drink (of course, Coke).
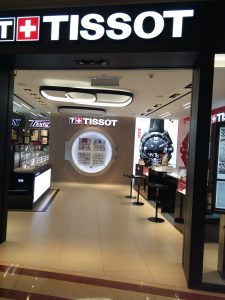
A leading premium watch brand
Brands help their owners to generate enduring revenue. These brands are valuable, and they are important intangible assets for corporations.
Methodologies to Value Brands
According to Gabriela Salinas in The International Brand Valuation Manual, there are many methods used to value brands. Many methodologies are developed by brand consulting companies, and one of the most famous methodologies is the Interbrand method.
Valuation Using Interbrand Method
Interbrand is a brand consultancy firm, specializing in areas such as brand strategy, brand analytics, and brand valuation. Its Interbrand method determines the earnings from a brand and capitalizes them by making suitable adjustments. The firm bases its brand valuation on financial analysis, role of the brand and brand strength. In order to calculate brand value, Interbrand uses a five-stage process as follows:
Segmentation: This stage consists of determining the main homogeneous client groups on which the financial and demand analysis are based.
Financial analysis: Through this analysis, the model attempts to establish “economic earnings”, also referred to as “intangible earnings”.
Demand analysis: In this step Interbrand establishes the “Role of Brand Index (RBI)” or the percentage of intangible earnings attributable to earnings, referred to as brand earnings.
Brand strength analysis: Through competitive analysis, Interbrand analyses brand strength which is in turn related to discount rate.
Brand value calculation: In this stage, the discount rate is applied to “brand earnings.” The sum of the present value of brand earnings represents brand value. Stage 1: Segmentation
According to Interbrand, as consumer attitudes and behaviours towards brands vary from sector to sector depending on product type, distribution and other market factors, brand value can only be accurately be determined through separate evaluation of the individual segments that represent a group of homogeneous consumers.
Stage 2: Financial analysis-Estimation of “Economic Earnings”
To isolate earnings specifically attributable to the brand, Interbrand determines Economic Value Added, which indicates if a company is capable of generating returns that exceeds the cost of capital employed.
Stage 3: Demand analysis or role of brand index (RBI)
RBI is a measure of how a brand influences customer demand at the point of purchase.
RBI is determined via a three-step process:
Firstly, Interbrand identifies the demand drivers or the factors that motivate customers to purchase a particular brand.
Step 2 determines the relative importance of the specific attributes in step 1.
Lastly, InterBbrand determines the role that the brand plays in each of these drivers. The RBI is expressed as a percentage, such that if RBI is 30%, 30% is extracted from intangible earnings.
Stage 4: Brand strength analysis-Determination of brand risk and discount rate
Brand strength represents the brand’s relative capacity to “guarantee demand” and in this way sustains future earnings. This analysis yields the brand risk which is later expressed as a discount rate. The determined discount rate is then applied to earnings attributable to brand in order to arrive at the brand value.
Stage 4.1: Brand strength analysis
In this stage, the brand strength is compared with that of its competitors for each of the seven brand strength factors. Table 1 shows how Interbrand analyses these attributes as a function of other sub-attributes or sub-criteria. For example, the “market” factor is analysed based on “industry concentration” and “market growth” criteria.
Table 1: Brand Strength Specific Attributes
Factor
Evaluation Criteria
Maximum Score
Leadership
Market share, market position, market segment and brand awareness
25
Stability
History, current position, satisfaction, customer loyalty
Quality, consistency is translated in term of advertising, identity
10
Protection
Date of registration, legal coverage and monitoring
5
Source: Interbrand
Stage 4.2: Determination of discount rate
A discount rate that adequately reflects the brand risk profile is used to calculate the present value of future brand earnings. The model assumes a relationship between brand strength and discount rate: the higher the brand strength score, the lower the discount rate. The brand strength index calculated in Stage 4.1 is translated into a discount rate using an S-curve. Thus, a brand with an average strength score will be discounted at the industry WACC, and a leading brand with a maximum brand score of 100 will be discounted at a risk-free rate. The relationship between brand strength index and discount rate in the Interbrand method is shown in Table 2.
Table 2: Relationship between Brand Strength and Discount Rates
Brand Strength Index
Discount Rate
100
5.0%
75
7.1%
50
10%
0
34.1%
Stage 5: Calculation of Brand Value
The present value of brand earning is inversely related to brand risk. To calculate brand value for a particular segment, future brand earnings are discounted at present value and an annuity or perpetuity is calculated as a terminal value. The sum of the value of the individual segments yields the total value of the brand.
The Interbrand method’s various components and their inter-relations can be summarised as follows:
The financial analysis stage is used to determine intangible earnings;
The RBI module is used to determine the ratio of brand earnings to total intangible earnings; and
The brand strength analysis module is used to determine the discount rate required for re-expressing future brand’s earnings at present value.
Example of Brand Valuation Using Interbrand Method
When using Interbrand method, brand value is the net present value of the forecast brand earnings, discounted by the brand discount rate. The net present value calculation comprises both the forecast period and the period beyond, reflecting the ability of brands to continue generating future earnings. An illustration of brand valuation using Interbrand model is shown in Table 3.
Table 3: Valuation Using Interbrand Method
Year ended December 31st,
Year 1
Year 2
Year 3
Year 4
Year 5
FINANCIAL ANALYSIS
Market (units)
150,000
153,000
156,366
161,057
167,499
Market growth rate
2%
2%
2%
2%
Market share (volume)
15%
17%
19%
21%
23%
Volume
22,500
26,010
29,710
33,822
38,525
Price
10.00
10.00
10.25
10.50
10.75
Price change
3.00%
2.50%
2.00%
2.00%
Branded revenue
225,000
267,903
312,136
362,233
422,425
Cost of sales
40%
90,000
107,161
124,854
144,893
168,970
Gross margin
135,000
160,742
187,282
217,340
253,455
Marketing costs
18%
40,500
48,223
56,184
65,202
76,036
Depreciation
0.75%
1,688
2,009
2.341
2,717
3,168
Other overheads
5.1%
11, 475
13,663
15,919
18,474
21,544
Central cost allocation
1.2%
2,700
3,215
3,746
4,347
5,069
EBITA (Earnings before interest, tax and amortization)
78,638
93,632
109,091
126,601
147,637
Applicable tax
35%
27,523
32,771
38,182
44,310
51,673
NOPAT (Net operating profit after tax)
51,114
60,861
70,909
82,290
95,964
Capital employed
78,525
93,498
108,935
126,419
147,426
Working capital
67,532
80,408
93,684
108,721
126,687
Net PPE
10,994
13,090
15,251
17,699
20,640
Capital charge as % of capital employed
8%
6,282
7,480
8,715
10,114
11,794
Intangible earnings
44,832
53,381
62.195
72,177
84,170
DEMAND ANALYSIS
\
Role of branding Index
70%
Brand earnings
31,383
37,367
43,536
50,524
58,919
COMPETITIVE BENCHMARKING
Brand strength score
66
Brand discount rate
7.40%
0.931
0.867
0.807
0.751
0.699
Discounted brand earnings
29,217
32,397
35,141
37,944
41,184
BRAND VALUE
NPV (Net present value of discounted brand earnings from Year 1 to Year 5)
175,883
NPV of discounted brand earnings beyond Year 5 at 2.5% growth rate
938,089
Brand Value
1,113,972
The Interbrand method assumes that in order to arrive at earning attributable to intangible assets, a capital charge must be deducted from NOPAT.
Brand owner pays high rents to display its brand
Conclusion
Brands are valuable intangibles as they can generate continuing income for their owners. Brands can be licensed or sold to other corporations. Interbrand method is a useful tool used to calculate the value of a brand.
About the author:
We wish to inform that we have just accepted a position of Adjunct Professor at the Asia e University based in Subang Jaya, Malaysia. Asia e University is a private university approved by the Malaysian Higher Education Ministry, which offers both on-campus learning and on-line learning.
Many businesses, including services firms, do not realize they have intellectual property rights that are valuable, such as trademarks and copyrights, and that there are means to protect them. Conversely, many businesses may think they own the intellectual property rights in work they paid for, such as custom software, when in fact they may not hold any such right at all.
Generally, there are four categories of intellectual property: trademarks, copyrights, patents and trade secrets:
Trademarks are words, symbols or phrases that are used in connection with a good or service and identify the source of the product or service. For instance, Coke is a trademark used in connection with carbonated soft drinks and the source is The Coca Cola Company.
Copyrights are rights created from an original work of authorship that is reduced to a tangible medium, such as books, artwork, even software programme and website content.
Patents encompass “inventions’-novel and non-obvious utilitarian processes, matter or articles of manufacture-and can include design patents or business method patterns.
Trade secrets are non-public information and know-how that would have a value to a competitor. Following the Coke example, the formula for Coke is considered one of the most valuable trade secrets in the world.
It is important for firms and companies to take time and efforts to review their business information to understand and grasp the value of their intellectual property and to determine what rights they actually hold and those they do not. Intellectual property lawyers assist their clients in conducting what is referred to as an “intellectual property audit” to give a business a picture of its rights.
K. S. Grimsley and P. K. Riewerts (CPA Practice Management Forum, July 2010) have suggested a list of items that such an audit might cover.
Trademarks Does the business have trademarks? Firms and companies should determine if they are using any trademarks in connection with their goods or services. For instance, do they use a design, word or phrase in connection with a product, such as clothing, or pharmaceutical product, or a service such as accounting services or consulting service?
The use of a mark alone establishes trademark rights in the geographic area of use, which is beneficial in preventing others from using the same or a similar mark in the same geographic area. Registration acts as notice to the world that you own a trademark in a mark for particular goods or services, which is an important deterrent to third parties using the same or similar mark.
Thus, when doing an audit, companies should review their websites and marketing materials to determine what trademarks they have and whether these are registered or should be registered.
Are the business’s marks available for use? Another important aspect in reviewing trademarks is to make sure the marks the company is using are actually available for it to use as such. If the company is using a mark that is the same or similar to another mark by a prior user, the company could find itself in threatened or actual litigation for trademark infringement.
Consistent use of marks and policing marks. Once a company has established rights in a mark, two important aspects are to use the marks consistently and to police the marks. Regarding consistent use, the company should use the marks on products or in connection with the services in the same manner and form in which they are registered or if not registered, as the company has always used the mark. Strength in mark is built up through consistent use, and modifications could potentially hinder the company’s rights and registration.In addition, the company should police the marks to make sure other third parties are not using them. If a company does not watch its marks and contest others who infringe upon its mark, it runs a risk of losing its rights in the mark.
Licensing. A final task on trademark checklist is to determine if it is allowing others to use its marks. For instance, does the company have third parties it allows to use the mark? If so, does it have a license agreements in place outlining its rights in the mark and the fact that it will exercise quality control over how the mark is used by the third party? Failure to manage the quality of goods and services sold under the company’s marks-referred to as naked licensing-can potentially lead to losing the company’s rights in a mark. Thus, to maintain all rights, the company should have license agreements in place containing quality-control language, and the company should actually review the quality of those goods and services.
Copyrights Does the business have copyrighted materials? Companies should investigate what works of authorship they have created. This includes works created by employees in their scope of employment. Copyrights no involve just novels and artwork. If a company has created software programmes, training manuals or articles for its website, the creation of such material in some fixed medium creates copyright right in the material. To be copyright-able, the work must be fixed in a tangible medium of expression. The idea for a software programme or advertisement is not copyright-able; however, the company can protect the expression of the idea. Therefore, the software programme or brochure promoting the business is copyright-able. Copyright owners enjoy several exclusive rights in their works, including the right to reproduce the work, to make derivative works (adaptations or transformations of the original work), to redistribute the work and the right to display and perform the work publicly.
Why obtain copyright registration? With copyrights, the company is protected under the Copyright Act the moment a work is created. However, a company may want to consider obtaining copyright registration in these works. Registration is usually inexpensive and offers several benefits. It constitutes public notice the work is protected, which may deter others from copying the work without permission. Registration is mandatory before bringing a copyright-infringement lawsuit. A third benefit of timely copyright registration is that it entitles the registrant to certain legal remedies against infringers that would otherwise be available, such as statutory damages and legal fees. Otherwise, an award will be limited to actual damages and profits, which can be difficult and expensive to prove.
Employee works versus independent contractor works. To the extent that the company had work created by employees, that work is automatically deemed to be authored and owned by the employer under the work-for-hire doctrine. However, if the work is created by an independent contractor, it is likely that the rights in the work are actually owned by the independent contractor, and at most, the company may have a license to use the work, unless the contract specifically states that the company owns all intellectual property rights in the work. This issue arises frequently in situations of customized software and website development. Thus, to the extent that the company has had works of authorship created, such as software programme, website or survey manuals, the company should review the contracts to determine ownership rights. To the extent the company dose not own the rights, it should consider negotiating with the independent contractor to assign the right to the company.
Licensing. To the extent the company allows others to use its works, the company should make sure that it has licenses in place with these parties that fully explain its ownership in the works and the other party’s right to use them under terms of the license it grants. It may also want to make sure it has the right to terminate the license in the event of a breach of the license terms. Further, to the extent the company is using work that is owned by someone else, it should review the license agreement to determine its rights and obligation under the agreement.
Patents Does the business have patents? Patents cover a variety of technology, including inventions in connection with mechanical devices, processes, scientific compound combinations, new varieties of plants, software programme and product designs. Patents can also be obtained on novel and non-obvious business methods, although these types of patents are scrutinized heavily and take much longer to issue. A patent is issued by a national government and gives the holder the right to prevent others from making, selling or importing any device or process that infringes one or more claims in the patent. In most cases, this right is limited in time to 20 years from the date it is filed with the national government authority in charge of patent registration. It is important to note that patents are negative rights-that is, they provide a right to prevent others from doing certain things; in plain English what this means is that just because you have a patent, that does not mean you can sell or make the device because doing so could still infringe a prior patent.
Processes and procedures in place. To qualify as a patentable invention, the invention must meet certain requirements. Therefore, a business should ensure it has the proper processes and procedures in place to assess an invention for patentability. Such procedures include having employees notify the proper business personnel upon development of a potential invention and evaluating the strength of such invention.
Deadlines. It is of utmost importance to consult a patent lawyer early on in the invention process regarding the scope of prior art or the possibility of infringing another’s patent. As an example, in the US, patents must be filed within one year of the date of the product or service embodying the patent is sold, offered for sale, publicly used or publicly disclosed. In most countries like Malaysia, there is no grace period and the application must be filed before any commercial use or disclosure. By consulting a patent lawyer, a business informs itself of patentability requirements, application details and filing deadlines that could prevent an inventor from securing a patent. Likewise, is a business seeks to file foreign patent applications, a patent lawyer will be able to advise on tying back foreign filing benefits to an earlier application filing date, if addressed in a timely manner.
Record-keeping. In addition, a business should retain and keep accurate records of information associated with the invention, such as research and lab notebooks and designs. These materials are essential to establish the dates of creation for the invention and will be needed if the patent application or registration is challenged.
Employee works. Furthermore, protective measures should be implemented with employees developing inventions. Unlike copyrights, there are no work-for-hire doctrine in patent law. With one narrow exception, all patent right transfer must be in writing. Thus, a business should seek assignment agreements with its employees before the work begins to secure the rights of the business in the invention. The narrow exception exists for employees that have been “hired to invent”. Agreements allow for the smooth transition of ownership from the employee to the company. As an incentive to continue developing inventions, companies will often set up a royalty or profit sharing plan for any invention that proceeds to registration. Also, non-disclosure and confidentiality agreements should be secured with anyone developing, having access to or any knowledge of the invention, or anyone who is engaged to test the invention.
Trade Secrets Keeping trade secrets a secret. Trade secrets consist of information that is of value to the business owner and would be damaging to the business owner if disclosed to a competitor. A classic example is the Coke formula. From time to time, businesses will enter into negotiations with other businesses or individuals to team up for a business venture. Two parties could agree to create a software programme together, work on research and development together or work together in a particular project. During these negotiations, each party may disclose information that is considered confidential and could harm the party if disclosed to third parties. This could include trade secrets and other intellectual property. To protect this information, a company should make sure that it has a non-disclosure agreement in place requiring both parties use the information they receive specifically for the purpose under the business deal, that they will not disclose the information to any third party without permission and that at the end of the discussion, they will return all confidential information to the other party who owns it.
Conclusion A typical company may have one or more of the four categories of intellectual property. It is important that a company lists out the inventory of the type of the intellectual property and decides the proper action plans to be implemented.
Malaysian scientists participating in a technology exhibition
Introduction
Recently, we attended a talk by Dr. Joon Seok Lee, President, Korean Invention Promotion Association (KITA). The talk, Employee’s Patent Compensation System (EPCS) in Korea, was organized by Malaysian Association of Research Scientists (MARS). The EPCS has been a motivating factor for engineers and scientists in Korea to discover new innovations and allow their firms to commercialize these new innovations into world-beating marketable products.
We are all aware that Korea has become an advanced manufacturing nation with world-class companies. The EPCS,which was made a law, has a main objective to motivate employees who discover inventions to inform his/her companies (employers). In return the employers must decide whether to proceed with the registration of the patent and its commercialization.
Most major Korean companies have the EPCS in their human resources policies and compete for the best innovative staff and new graduates. A firm will establish a committee, comprising representatives of the firm and key employees to recommend the types of compensations to be given to employees who had developed an innovation that can be patented. Dr. Joon noted the compensations can be:
Promotion
Holidays
Share of profits
Monetary rewards
Others
Other countries that estabished EPCS are Japan and Germany. In Japan, all large companies and about 80% of SMEs have EPCS as part of the companies’ human resource policies.
Impact on Innovation in Companies
We asked Dr. Joon whether the EPCS has increased the capacity of Korean firms to innovate as employees are now more motivated to innovate. His answer was a clear Yes. In fact, many employees have received large compensations in the form of promotions and monetary rewards.
We all know that Germany, Japan and Korea have well-known manufacturing giants. These countries also have innovative SMEs with leading products in their market segments. Now we know the EPCS is one of their secret tools to motivate their scientists and engineers to develop new inventions, and, in the process, gain high rewards.
It is timely that Malaysian firms to introduce EPCS in their human resources policies. In Korea, companies that have established EPCS also enjoy government incentives in the form tax deduction.
In Malaysian universities and R&D institutions, engineers and scientists have been provided with incentives. Among the incentives include:
A share in the licensing fee generated from the licensing of the technologies discovered.
He/she is allowed to be a shareholder or director of the company formed to commercialize the technology.
He/she can for a grant from a government company, Malaysian Technology Development Corporation (MTDC) to commercialize the technology.
He/she can gain promotions.
Malaysian engineer standing with a colleague
We are not aware of incentives given by large Malaysian private companies to motivate their engineers and scientists to be more innovative besides getting promotions.
As countries such as Japan, Germany and South Korea had shown motivating their scientists and engineers to discover new innovations can strengthen their innovative capacities.